

If you've been trading for a while, you've probably heard traders talk about "the smart money" — the big institutions that move the markets before retail traders even know what happened. Candle Range Theory, or Candle Range Theory (CRT), is one of the concepts that helps you understand how those moves work and how you can position yourself on the right side of them.
What Is Candle Range Theory (CRT)?
Candle Range Theory is a trading concept based on a simple but powerful idea: every candle on your chart is a range. And inside that range, price goes through a predictable three-part process.
This three-part process is called PO3, which stands for Power of 3. It means:
- Accumulation — Price builds up energy in a tight range
- Manipulation — Price spikes in one direction to trap traders (the fake-out)
- Distribution — Price then moves hard in the opposite direction (the real move)
Think about it this way. Imagine you're at a market and you want to buy apples cheaply. You wouldn't just walk in and buy at the current price. You'd wait for the vendor to lower the price, or you'd create a situation where others sell theirs cheap so you can scoop them up. That's essentially what big institutions do in the market. They manipulate price briefly to collect orders, then send price where they actually want it to go.
CRT gives you a framework to spot that manipulation — and trade the real move that follows.
Every single candle on your chart, whether it's a 1-hour candle, a 4-hour candle, or even a daily candle, has this same process hidden inside it. Once you start seeing it, you can't unsee it.
The Core Mechanics: How Candle Range Theory (CRT) Actually Works
Here's the basic setup in plain English.
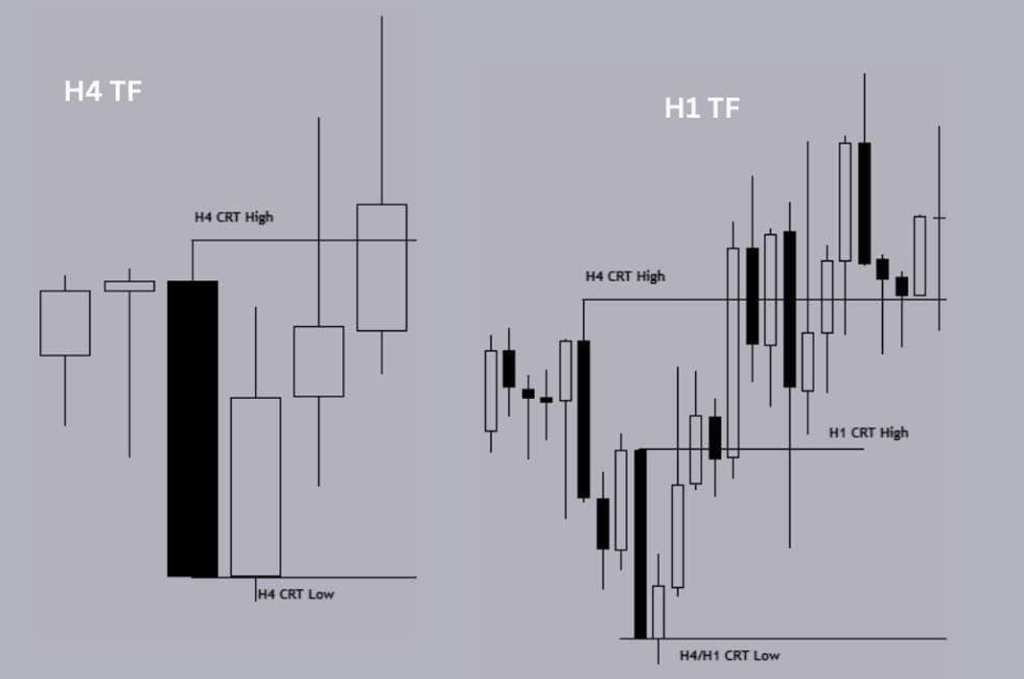
You pick a candle — let's say a 4-hour candle that forms at a specific time of day (more on the times in a moment). That candle has a high and a low. Those are your CRT High and CRT Low.
Now here's what you're watching for: the next candle comes in and breaks above the high or below the low of that first candle. It looks like price is about to go in that direction. Most retail traders get excited and jump in.
But then — price comes back. The second candle closes back inside the range of the first candle. That spike was a fake-out. A trap. The liquidity grab.
That's your signal. Price grabbed the stops sitting above the high or below the low, filled the big orders, and is now ready to move in the opposite direction. That's where you enter on the lower timeframe and ride the real move.
Simple concept. But the execution requires some patience and context, which we'll cover as we go.
Why Higher Timeframe Bias Matters Before Anything Else
Here's something most traders skip, and it's exactly why they lose money with CRT.
Before you even look for a CRT pattern, you need to know which direction the market wants to go on the higher timeframe. This is called your HTF (Higher Time Frame) bias.
If the daily or weekly chart is in a strong uptrend and price is sitting at a discount area, you should only be looking for CRT setups that point up — setups where price grabs the low, traps sellers, then rockets upward.
If you're trading against the HTF bias, you're basically swimming upstream. The pattern might form perfectly, but it'll fail. And you'll sit there wondering what went wrong.
Think of HTF bias like the wind direction. CRT is your sail. If the wind is blowing north and your sail is pointing south, no amount of technique is going to help you.
So step one, always, is to zoom out. Look at the weekly. Look at the daily. Ask yourself: where is price in the big picture? Is it at a premium (overpriced zone) or a discount (underpriced zone)?
Only sell when price is in a premium zone. Only buy when price is in a discount zone. This one rule alone will filter out most of the bad trades.
Key Levels You Must Identify Below Candle Range Theory (CRT) Low and Above CRT High
Now here's another layer that separates the high-probability CRT trades from the garbage ones.
Below the CRT Low or above the CRT High, there should be a key level. Specifically, one of these:
- Order Block (OB) — A zone where institutions previously placed large orders
- Mitigation Block — A failed order block that price comes back to "fix"
- Breaker Block — An order block that price has already broken through and is now using as resistance/support
- Fair Value Gap (FVG) — A price inefficiency where the market moved so fast it left a gap that needs to be filled
- SSL/BSL — Sell-side or buy-side liquidity — areas where stop losses are clustered
When price dips below a CRT Low and there's an Order Block or Fair Value Gap sitting right there, you have a high-probability buy setup. The CRT Low grab isn't random — it's doing the job of sweeping liquidity AND tapping into a key support level at the same time.
When you get that combination — CRT pattern + HTF discount zone + key level right there — that's the trade you've been waiting for.
One without the others is weak. All three together is powerful.
The Premium and Discount Rule: Only Trade in the Right Zone
Let's spend a moment on this because it trips up a lot of people.
Every market has a range. Within that range, the upper half is called the premium and the lower half is called the discount. The midpoint (50%) divides the two.
The rule is dead simple: sell in the premium, buy in the discount.
Institutions don't buy at the top and they don't sell at the bottom. They do the opposite of what most retail traders do. So if price has been running up and is now in the top half of a major HTF range, you should be looking for CRT sells, not buys.
If price just swept a key low and is now in the bottom half of the range, look for CRT buys.
When price is at the CRT High and it's also in a HTF premium zone, you've got alignment. That's a sell setup worth considering. When price is at the CRT Low and it's in a HTF discount zone, that's your buy setup.
This is what the PDF means when it says "SELL AT THE PREMIUM BUY AT THE DISCOUNT." It sounds obvious but most people don't actually do it.
Time Is Everything: The Specific Sessions That Make Candle Range Theory (CRT) Work
Here's where CRT gets really interesting and very specific.
CRT isn't just about the pattern. It's about when the pattern forms. Time is one of the three pillars of a valid CRT trade (along with key levels and pattern). Without the right timing, even a perfect-looking pattern has much lower odds.
Forex Timing
For Forex traders, here are the key times to watch:
4-Hour Timeframe: Look for CRT formations at 1am, 5am, and 9am EST. These times align with when major sessions open or when institutional algorithms kick in. The 4-hour candles that form at these times frequently become the CRT candle that sets up the trade.
1-Hour Timeframe: Watch for setups at 3am, 6am, and 9am EST. These are high-probability moments for the 1-hour CRT to develop. The 3am to 9am window is particularly powerful because it bridges the London and New York sessions — the two most liquid trading windows in the world.
The "369" system in the PDF refers to 3am, 6am, and 9am. The idea is that the 3am and 9am candles often form at swing highs or lows, and then the 6am candle is the one that provides the real move. Understanding this sequence helps you time your entry much more precisely.
Index Futures Timing in Candle Range Theory
For traders in S&P 500, NASDAQ, or other index futures, the timing shifts slightly:
4-Hour Timeframe: Key times are 2am, 6am, and 10am EST. The 10am time is especially significant because it's right after the New York open and when a lot of institutional order flow comes through. Many of the cleanest setups on NQ1 (NASDAQ futures) happen right around that window.
The "2-6-10" system is essentially the index futures version of the Forex "1-5-9" concept. Same logic, slightly different times because of how the futures markets open and when liquidity is highest.
Why do these specific times matter? Because institutional algorithms and large banks place orders at predictable intervals tied to session opens, economic releases, and fixing times. The market isn't random — it's structured. These are the times when that structure shows up most clearly.
The "159" Setup Explained (Forex 4-Hour CRT)
The 159 setup is one of the primary CRT patterns for Forex traders working on the 4-hour chart.
Here's how it plays out in a real scenario:
Imagine it's 1am EST. A 4-hour candle opens. By 5am, that candle has formed a clear high or low — let's say it's a low. The 5am candle that follows takes out that low (purges the liquidity below it), then closes back above it. By 9am, price is moving in the opposite direction — up.
The 1am candle set the range. The 5am candle was the manipulation (the false break). The 9am candle and beyond is the real distribution — the move you wanted to be in.
Case study charts in the PDF show this playing out repeatedly on EURUSD. You'll see the swing highs and swing lows forming precisely at the 1am, 5am, and 9am marks on the 240-minute (4-hour) chart. This isn't coincidence — it's the institutional timeframe at work.
The "369" Setup Explained (Forex 1-Hour CRT)
The 369 setup operates the same way but on the 1-hour chart, and the timing is 3am, 6am, and 9am EST.
Here's the real-world flow: the 3am candle forms and marks out a swing high. The 6am candle breaks that high (false breakout), then closes back below it. Price then sells off sharply into the 9am window.
The case study in the PDF shows this on EURUSD on the 60-minute chart. You can see the 3am and 9am candles consistently marking the swing points, with the 6am often being the manipulation or the start of the real move.
The beauty of the 369 is that it fits perfectly into London session dynamics. London opens around 3am EST, which is why you see so much activity then. By 9am EST, New York has opened, and the two sessions overlap — which is the highest volume period of the day. Moves that start in London often accelerate when New York joins in.
The "2-6-10" Setup for Index Futures and Gold
For those trading NQ, ES, or Gold futures, the equivalent setup is the 2-6-10 system.
The 2am candle on the 4-hour chart often marks a significant level. The 6am candle is frequently the manipulation point — the false move that traps traders. And by 10am EST, the real directional move is underway.
The PDF's case study on NQ1 (NASDAQ futures) on the 240-minute chart shows this clearly. You can see the 2am, 6am, and 10am marks repeatedly lining up with swing highs and lows. The market makes its manipulation move around 6am, sweeps liquidity, then the 10am candle opens into New York and drives the real direction.
The Gold futures case study (GC1 on the 240-minute chart) shows the same 2am-6am-10am rhythm. Gold is especially interesting because it's heavily influenced by both the London open (around 3am EST) and the New York session, so institutional order flow at these times is massive.
Timeframe Alignment: HTF Candle Range Theory (CRT) to LTF Entry (TSQ)
One of the most important concepts in the PDF is timeframe alignment. You don't just trade the CRT pattern in isolation — you use it on the higher timeframe to understand the range, then drop down to a lower timeframe to find your entry.
The alignment works like this:
- If your CRT is on the Weekly chart, your entry timeframe (LTF) is the 4-hour
- If your CRT is on the Daily chart, drop to the 1-hour for entries
- If your CRT is on the 4-hour chart, use the 15-minute for entries
- If your CRT is on the 1-hour chart, use the 5-minute for entries
This multi-timeframe approach is what gives CRT its precision. The higher timeframe tells you the story — where price is manipulating and where it's going. The lower timeframe gives you the entry — the exact moment to pull the trigger with a tight stop loss and a favorable risk-to-reward ratio.
Once you've identified the CRT pattern on your HTF, you go to the LTF and look for what the PDF calls TSQ — The Sequence. This is a series of lower timeframe entry patterns that confirm your thesis. The Sequence includes:
CRT Turtle Soup — A classic liquidity grab pattern on the LTF that mirrors the HTF CRT. Price sweeps a recent high or low then reverses. It's called "Turtle Soup" because it's trading against the Turtle Traders' breakout strategy — you're fading the breakout instead of following it.
CSD — This stands for a specific confluence entry model. When the LTF candle shows the same PO3 (accumulation, manipulation, distribution) as the HTF CRT, you have a CSD — a nested confirmation that both timeframes are aligned.
OTE (Optimal Trade Entry) — This is the Fibonacci-based entry zone, typically the 61.8% to 79% retracement level. After the manipulation move, price often retraces to this golden zone before continuing in the real direction. This is your ideal entry point.
Continuation — Sometimes after the initial move, price pulls back to a previous order block or fair value gap before continuing. That pullback is your second chance to enter if you missed the first one.
KOD (Kiss of Death) — This is the final entry pattern where price comes back one last time to "kiss" a key level before making a decisive move. It sounds dramatic, and it kind of is — it's often the last chance to get on board before price takes off.
Read: 📊 MetaTrader 5 Beginner Guide
Why Candle Range Theory (CRT) Patterns Fail (And What to Do About It)
Here's the honest part that most trading educators skip: CRT doesn't work every single time. The PDF is very direct about this. "Pattern alone never works always."
So let's talk about why it fails and how to protect yourself.
Reason 1: No HTF Confluence
The biggest reason CRT fails is when traders take the pattern without checking the higher timeframe. If you're taking a CRT buy setup but the daily and weekly charts are in a clear downtrend, you're fighting a losing battle. The pattern might look perfect, but the larger trend will eventually win. Always, always check your HTF bias first.
Reason 2: Wrong Time
Taking a CRT setup at noon EST when none of the key institutional times are active is a red flag. The pattern needs time confluence. Without it, you're just seeing shapes in the chart that don't have institutional backing behind them.
Reason 3: No Key Level Below/Above
A CRT Low grab that isn't backed by an Order Block, FVG, or other liquidity zone is a weak setup. The manipulation needs a reason to stop. If there's no key level for price to react from, the "reversal" might just keep going, and your CRT becomes a breakout trade that goes against you.
Reason 4: Wrong Zone (Premium vs. Discount)
Taking a CRT buy in a premium zone or a CRT sell in a discount zone goes against the principle of institutional trading. Smart money buys cheap and sells expensive. If you're doing the opposite, you're on the wrong side.
Reason 5: Not Enough Inside Bars
The PDF makes an interesting point: "More the inside bars, higher the probability." Inside bars (candles that form within the range of the previous candle) indicate consolidation and accumulation. The more of them you see building up, the more compressed the energy — and the more explosive the eventual move. A CRT setup with multiple inside bars building up is much stronger than one with just a single candle.
How to Protect Yourself
When the pattern plays out and price reaches the 50% level of the CRT range, that's your signal to book partial profits. Take some money off the table. Move your stop loss to breakeven. This way, even if the trade doesn't fully deliver, you've captured a chunk of the move and you can't lose money on the trade.
This is called "moving to break even at 50%," and it's one of the most practical risk management tips in the entire PDF.
Download PDF:
Step-by-Step: How to Actually Trade Candle Range Theory (CRT)
Let's put it all together in a simple step-by-step process.
Step 1: Establish Your HTF Bias
Go to the weekly or daily chart. Determine whether price is bullish or bearish. Identify where price sits — premium or discount zone?
Step 2: Identify Key Levels
Mark your key levels — Order Blocks, Fair Value Gaps, Mitigation Blocks, Breaker Blocks, and liquidity pools (SSL/BSL). These are your magnets. They're where price is likely to react.
Step 3: Wait for the Right Time
Set alerts for the key CRT times. For Forex: 1am, 3am, 5am, 6am, 9am EST. For Index/Gold Futures: 2am, 6am, 10am EST. Don't force trades outside these windows.
Step 4: Spot the CRT Formation
Watch the candle forming at the key time. Note its high and low (CRT High and CRT Low). Then watch the next candle. Does it break above the CRT High or below the CRT Low? If yes, does it then close back inside the first candle's range? That's your CRT pattern.
Step 5: Confirm with Key Level
Is there an Order Block or FVG right below that CRT Low (for a buy) or above that CRT High (for a sell)? If yes, you have confluence.
Step 6: Drop to LTF for Entry
Go to your lower timeframe (15min or 5min depending on your HTF CRT). Look for TSQ — one of the entry patterns like CRT Turtle Soup, OTE, or CSD. Enter your trade at the optimal point with a tight stop loss just below the key level.
Step 7: Manage the Trade
Target the opposite CRT level (CRT High if you entered long, CRT Low if you entered short). At the 50% midpoint, take partial profits and move stop to breakeven. Let the rest run to the full target.
Real Examples: Case Studies from the PDF
The PDF includes real chart examples from EURUSD and NQ1 (NASDAQ futures) that bring all these concepts to life.
On the EURUSD 60-minute chart, you can clearly see the 3am and 9am candles consistently forming at swing highs and lows. The 6am candle acts as the bridge — sometimes the manipulation point, sometimes the beginning of the distribution. Trading this rhythm on a currency pair as liquid as EURUSD gives you consistent opportunities throughout the week.
On the EURUSD 240-minute chart (4-hour), the 1am, 5am, and 9am candles line up with major turning points across multiple weeks of price action. Every single marked swing high or low corresponds to one of those key institutional times. This isn't cherry-picked. It's the structure of the market repeating over and over.
On NQ1 (NASDAQ futures), the 2am, 6am, and 10am times show the same behavior. In an uptrending market, the 6am candle would sometimes create a false dip (taking out the 2am low), then the 10am open would push price strongly to new highs. That's the CRT playing out on futures.
Gold futures (GC1) also show this cleanly. The 2am candle often sets the direction, the 6am creates the stop hunt, and the 10am delivers the real move. Gold is particularly responsive to these times because major central bank and institutional flows happen during the London and New York overlap.
Points to Remember: Your Candle Range Theory (CRT) Cheat Sheet
The PDF wraps up with a summary that's worth keeping somewhere you can see it every day. Here it is in conversational form:
Pattern alone is never enough. If you see a CRT but you don't have HTF bias, key levels, and timing — pass on the trade. There will always be another setup.
Only sell at premium, only buy at discount. Don't chase. Wait for price to come to you in the right zone.
Watch the key times. Your attention should be highest during the 1am, 3am, 5am, 6am, 9am, and 10am EST windows. Outside of those, you can relax.
CRT with HTF alignment wins more. The more confluences you stack — HTF trend, key level, right time, right zone — the higher your win rate.
More inside bars = higher probability. If you see price compressing with multiple inside bars before a CRT setup, that's a strong signal that a big move is coming.
Take partials at 50%, move stop to breakeven. Risk management is what keeps you in the game long enough to win.
Final Thoughts: Is Candle Range Theory (CRT) Worth Learning?
Absolutely — with one condition. You have to approach it the right way.
CRT is not a magic pattern. It's a framework for understanding how institutional money moves through the market at specific times of day. When you combine that framework with higher timeframe bias, premium/discount zones, key levels, and proper timing — you get a trading approach that's actually rooted in market logic.
The traders who fail with CRT are the ones who take every fake-out they see and call it a CRT setup. The traders who succeed are the ones who wait — sometimes days — for all the pieces to align before pulling the trigger.
Trading is a patience game. CRT rewards patience. Master the framework, apply it with discipline, and it becomes one of the most reliable concepts in your trading toolkit.
Start with the 4-hour Forex setup. Watch the 1am, 5am, and 9am candles on EURUSD or GBPUSD for a few weeks without trading. Just observe. See how often those candles form the swing highs and lows. Once you start seeing it consistently, you'll understand exactly what this concept is teaching you — and you'll be ready to trade it.
Good luck out there.
Disclaimer: This article is for educational purposes only and does not constitute financial advice. Trading involves significant risk of loss. Always do your own research and consider consulting a licensed financial advisor before making any trading decisions.